

THE BOTTOM LINE
The stock market’s attempt to sell off on Thursday was tipped off by a short term negative divergence in our SAMMY tactical supply and demand indicator. However, the attempt to take the price lower was met almost instantly by aggressive bidding resulting by Friday’s close in new all-time highs for the S&P-500. This immediate response to an attempt to take prices lower suggests the firm bid under the market for these last months remains strong, implying new all-time highs are likely in the short term. The persistent negative divergence in the SAMMY indicator also implies the extending rally be accompanied by rising volatility, and more weeks like the one just past.
Rally Extending

The S&P-500 made a new all-time high on this past Wednesday, then gapped down on the open Thursday over 500 Dow points, and almost immediately found aggressive bidders, which gave way to a new budding rally. On Friday’s open the market gapped higher powered by strong bidding, and by the close the S&P-500 was once again at new all-time highs. Screenshot-249 shows how this bumpy ride played out on the daily chart.
TATY — A REPRESENTATIVE OF A FAMILY OF STRATEGIC SUPPLY AND DEMAND INDICATORS
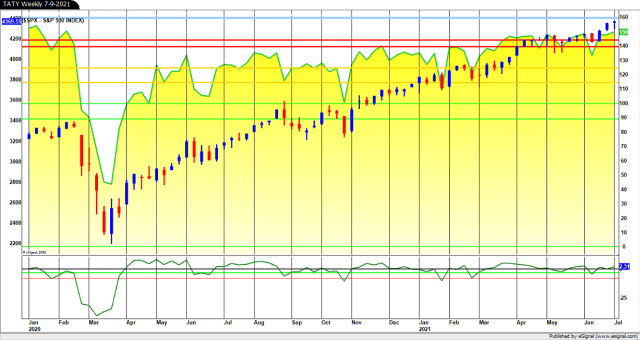
TATY is shown in Snapshot-283 in yellow with the S&P-500 overlaid in red and blue candle chart format. TATY finished the week at 150, which is its highest level since January 2020. While TATY has not yet begun to oscillate with bottoms near the red zone surrounding the 140 level, and tops near the blue zone at the 160 level, its close at the 150 level tends to confirm the extending rally. In the absence of a “Big Chill” warning, the implication is the rally remains healthy.
SAMMY — A REPRESENTATIVE OF A FAMILY OF TACTICAL SUPPLY AND DEMAND INDICATORS

SAMMY is shown above in Screenshot-250 in rarely shown 130 minute format with SAMMY in the top panel, and the S&P-500 in the lower panel in candle chart format. Please notice that in Screenshot-250 a short term negative divergence had developed at the Wednesday all-time price high. This is shown on the chart as a down sloping dashed orange line on the top panel. The all-time new high is shown in the lower panel by the rising solid orange line. Given this obvious negative divergence, Thursday plunge opening was not a complete surprise.
However, the almost immediate arrival of motivated and aggressive bidders resulting in Friday’s new all-time high (up sloping green solid line) has (so far) failed to erase the continuing negative divergence shown by the down sloping green dashed line. So, a mixed bag of a new high for TATY confirming the rally, and a continuing negative divergence in SAMMY, which cast a short term shadow on the staying power of this leg up in the rally.

SAMMY is also shown in Screenshot-248 in weekly format with the often mentioned long standing negative divergence still shown as a down sloping dashed orange line. SAMMY has a superior record of diverging at tops on weekly as well as shorter interval charts. If SAMMY continues to sustain its negative divergences to the rising price, then the implication would be for rising volatility for the remainder of the summer, and possibly into the fall.
Please be safe.
DISCLAIMER : Optimist Capital LLC, does not guarantee the accuracy and completeness of this report, nor is any liability assumed for any loss that may result from reliance by any person upon such information. The information and opinions contained herein are subject to change without notice and are for general information only. The data used for this report is from sources deemed to be reliable, but is not guaranteed for accuracy. Past performance is not a guide or guarantee of future performance. Optimist Capital LLC, and any third-party data providers, shall not have any liability for any loss sustained by anyone who relied on this publication’s contents, which is provided “as is.” Optimist Capital LLC disclaim any and all express or implied warranties, including, but not limited to, any warranties of merchantability, suitability or fitness for a particular purpose or use. Our data and opinions may not be updated as views or information change. Using any graph, chart, formula or other device to assist in deciding which securities to trade or when to trade them presents many difficulties and their effectiveness has significant limitations, including that prior patterns may not repeat themselves continuously or on any particular occasion. In addition, market participants using such devices can impact the market in a way that changes the effectiveness of such device. The information contained in this report may not be published, broadcast, re-written, or otherwise distributed without prior written consent from Optimist Capital LLC.